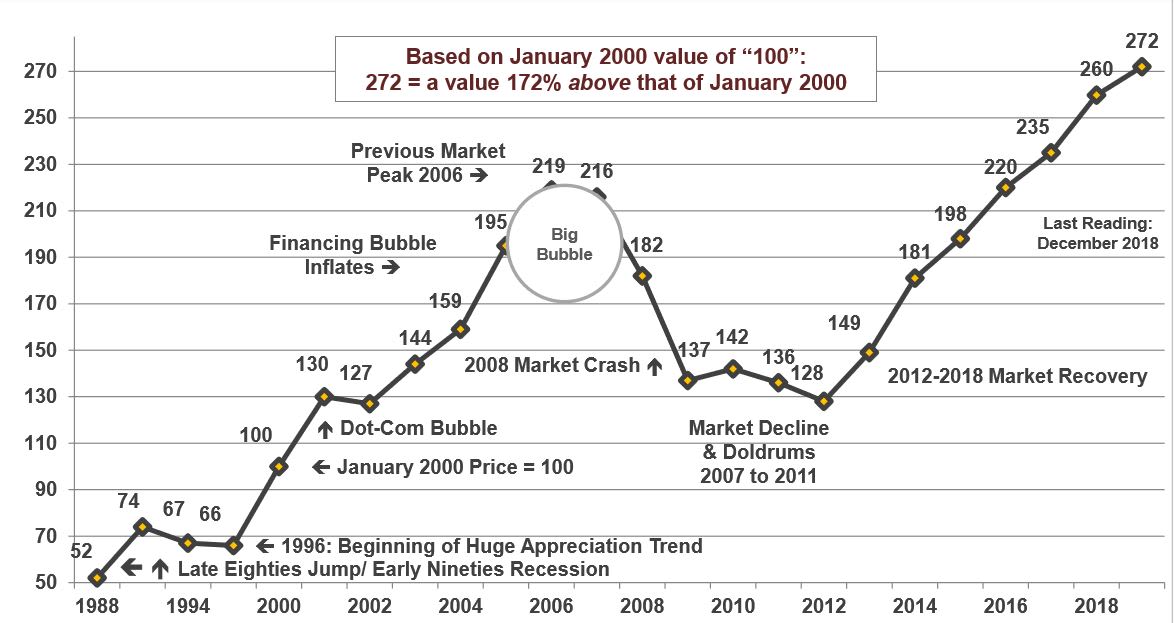
The CoreLogic S&P Case-Shiller Home Price Index does not evaluate median sales price changes, but employs its own proprietary algorithm to measure home price appreciation over time. Since its indices cover large areas – for example, the San Francisco Metro Area is comprised of 5 counties – which themselves contain communities and neighborhoods of widely varying home values, the C-S chart numbers do not refer to specific prices, but instead reflect prices as compared to those prevailing in January 2000, which are all designated as having a consistent value of 100. Thus a reading of 250 signifies that home prices have appreciated 150% above the price prevailing in January 2000.
Case-Shiller divides all the house sales in the SF metro area into thirds, or tiers. Thus the third of sales with the lowest prices is the low-price tier; the third of sales with the highest sales prices is the high-price tier; and the third in between is the mid-price tier. The price ranges of these tiers changes as the market changes. The 3 tiers experienced dramatically different bubbles, crashes and recoveries over the past 18 years, to a large degree determined by how badly the tier was affected by the subprime financing crisis. The low price tier was worst affected – huge bubble, huge crash, most dramatic recovery – and the high-price least affected (but still deeply affected).
Most of the house sales in expensive counties such as San Francisco, Marin and San Mateo, as well as affluent communities in other Bay Area counties are in the "high price tier", and many would qualify for an “ultra-high-price tier,” but C-S does not break that out.All the local counties, to varying degrees, have sales in all 3 price tiers.
The Index is published 2 months after each month delineated – the December 2018 index was released 2/26/19 – and reflects a 3-month rolling average, so in effect, it is looking into a rear-view mirror at the market 3 to 5 months ago.
The 5 counties in our Case-Shiller Metro Statistical Area are San Francisco, Marin, San Mateo, Alameda and Contra Costa: Alameda and Contra Costa are by far the largest markets; SF itself comprises only about 7% of house sales in the metro area. We believe the Index generally applies to other Bay Area counties, such as Sonoma and Santa Clara, as well. There are many dozens, if not hundreds, of unique real estate markets found in such a broad region, with different dynamics, moving at varying speeds, sometimes even moving in different directions. How the C-S Index applies to any particular property is impossible to say without a specific comparative market analysis.

*The C-S Index 5-county San Francisco Metro Statistical Area includes San Francisco, Marin, San Mateo, Alameda and Contra Costa counties. The Index is published 2 months after the month specified and reflects a 3-month rolling average. The chart reflects all price segments in the metro area, and San Francisco County is only a small percentage of overall metro area house sales.
CoreLogic S&P Case-Shiller Home Price Index: Appreciation since 1987 United States vs. San Francisco Metro-Area High-Price-Tier Index.


*The C-S Index 5-county San Francisco Metro Statistical Area includes San Francisco, Marin, San Mateo, Alameda and Contra Costa counties. The Index is published 2 months after the month specified and reflects a 3-month rolling average. The high-price tier reflects the top third of home sales in the SF metro area, which applies to the city of San Francisco better than other tiers.
San Francisco Bay Area Real Estate Market Cycles Home Price Increases & Declines, by Percentage, 1984 – Present.

* The years between market peaks and bottoms are not accurately represented, but entered as straight lines between high and low points to illustrate percentage changes over time. Shorter-term fluctuations are not reflected on this chart. All numbers are approximate and subject to revision.
CoreLogic S&P Case-Shiller Home Price Index Short-Term Changes by Price Tier, San Francisco 5-County Metro Area*
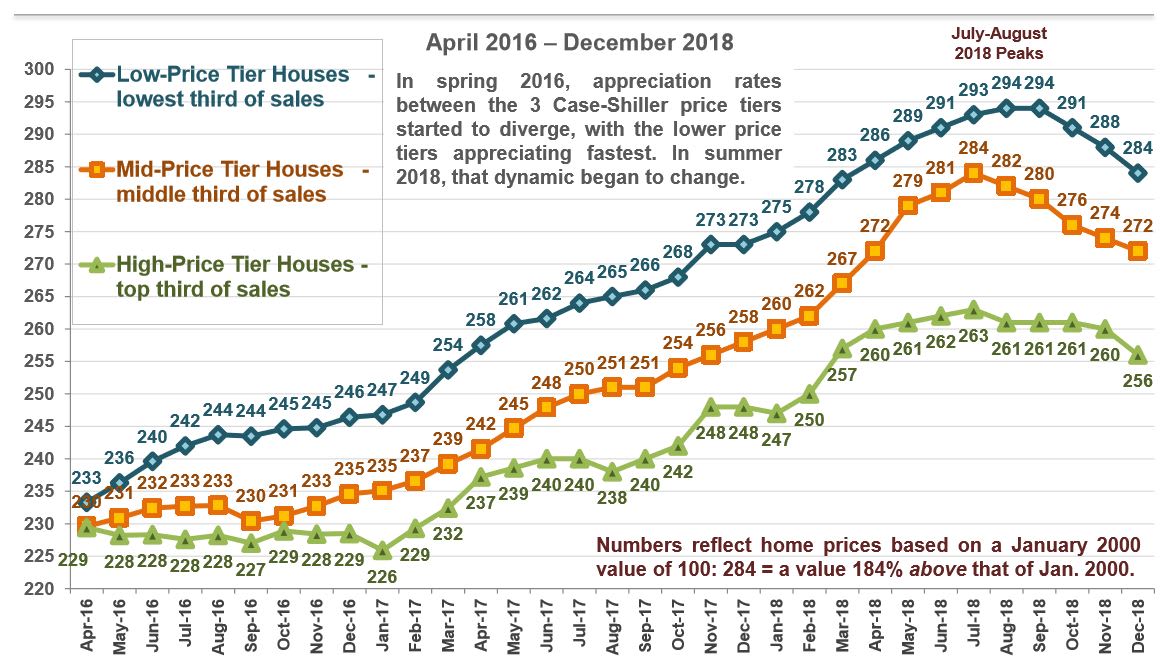

*Includes San Francisco, Marin, San Mateo, Alameda and Contra Costa counties. The Index is published 2 months after the month delineated and reflects a 3-month rolling average. Each house-price tier represents one third of the number of total sales. All numbers approximate and subject to revision.
CoreLogic S&P Case-Shiller High-Tier Home Price Index 2012 - Present, San Francisco 5-County Metro Area*
“High Tier” Price Houses: San Francisco METRO AREA*
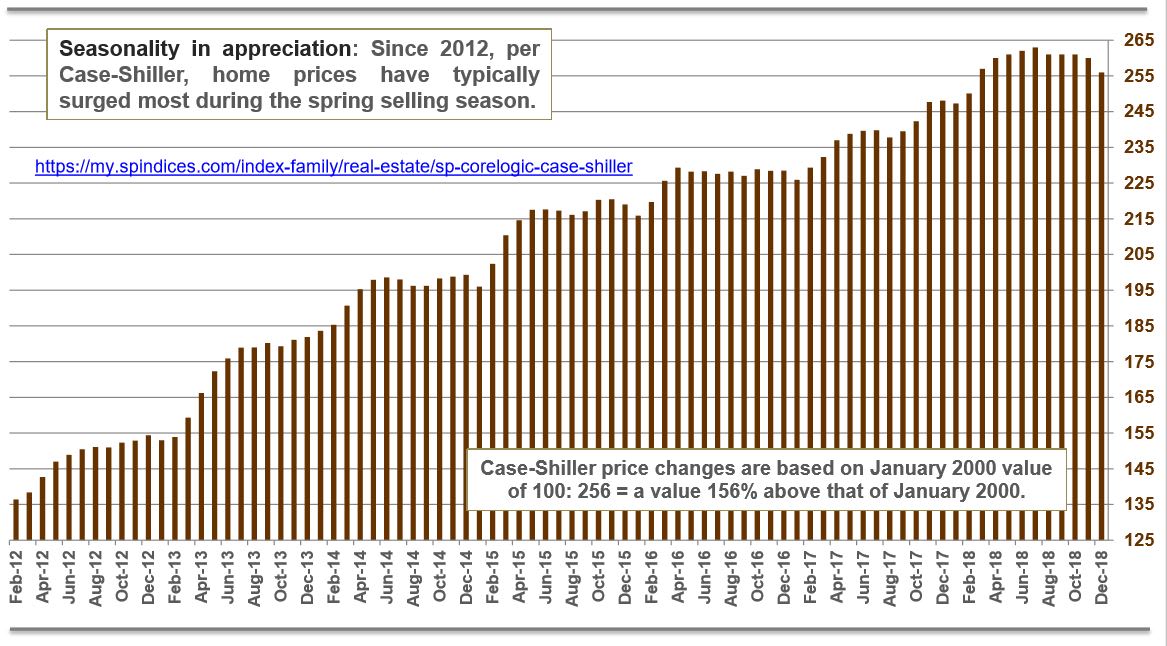

*The C-S Index 5-county San Francisco Metropolitan Statistical Area (MSA) includes San Francisco, Marin, San Mateo, Alameda and Contra Costa counties. Most of San Francisco, southern Marin, San Mateo and central Contra Costa house sales are “high tier”. The Index measures a 3-month rolling average. Reports are released 2 months after the month delineated.
“High Tier” Price Houses: San Francisco METRO AREA*
These analyses were performed in good faith with data derived from sources deemed reliable, but they may contain errors and are subject to revision
CoreLogic S&P Case-Shiller High-Price-Tier Home Index Short-Term Changes, San Francisco 5-County Metro Area*
“High Tier” Price Houses, San Francisco 5-County METRO AREA*

*The C-S Index 5-county San Francisco Metropolitan Statistical Area (MSA) includes San Francisco, Marin, San Mateo, Alameda and Contra Costa counties. The majority of the house sales in San Francisco, Marin and San Mateo are in the “high price tier”. The Index is published 2 months after the month delineated and reflects a 3-month rolling average. Short-term fluctuations are much less important than long-term trends.
CoreLogic S&P Case-Shiller Home Price Index since 1987 San Francisco Metro Area Trends by House-Price Tier*
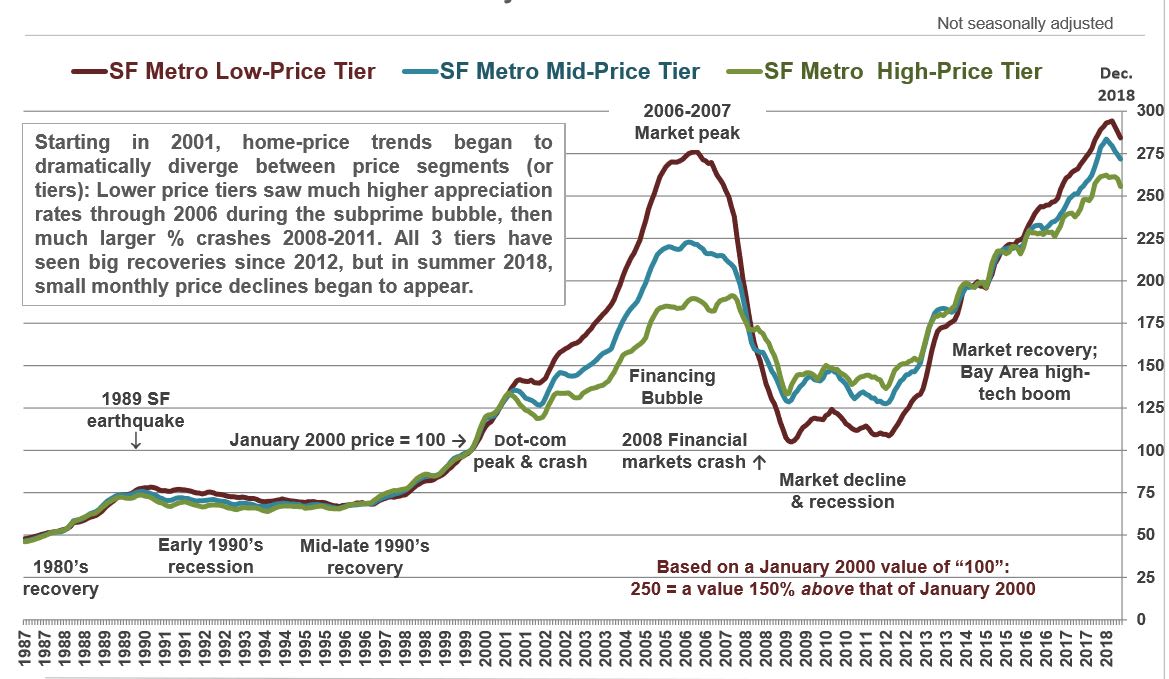
*The C-S Index 5-county San Francisco Metro Statistical Area includes San Francisco, Marin, San Mateo, Alameda and Contra Costa counties. The Index is published 2 months after the month specified and reflects a 3-month rolling average. Each price tier reflects one third of housing stock. Where these tiers range in prices varies as the market changes.

*The C-S Index 5-county San Francisco Metro Statistical Area includes San Francisco, Marin, San Mateo, Alameda and Contra Costa counties. The Index is published 2 months after the month specified and reflects a 3-month rolling average. Each price tier reflects one third of housing stock. Where these tiers range in prices varies as the market changes.
CoreLogic S&P Case-Shiller Home Price Index 1988 – Present, All Price Tiers, House Prices San Francisco 5-County Metro Area* – January Data Points.
Case-Shiller divides market into thirds by price and number of sales: low, mid and high price.
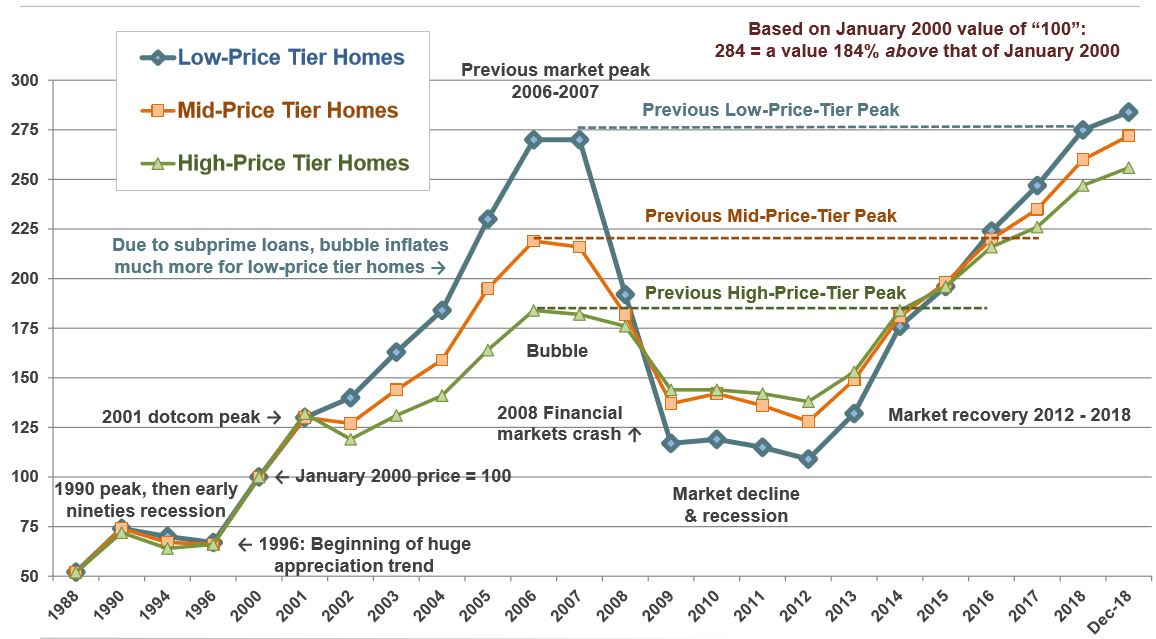

*The C-S Index 5-county San Francisco Metro Statistical Area includes San Francisco, Marin, San Mateo, Alameda and Contra Costa counties. The Index is published 2 months after the month specified and reflects a 3-month rolling average. Graph not proportional from 1988-2000. January data points except for last entry as noted. All numbers approximate and subject to revision.
S&P Case-Shiller High-Tier Home Price Index, 1988 – Present Real Estate Cycles, SF Bay Area
San Francisco 5-County Metro Area* – January Data Points.
“High Tier” Price Houses, January Data Points

Data points above are for January of each year, except as noted. *The C-S Index 5-county San Francisco Metro Statistical Area includes San Francisco, Marin, San Mateo, Alameda and Contra Costa counties. The Index is published 2 months after the month specified. In August 2018, the high tier began at $1.23 million. Graph not proportional from 1988-2000.
CoreLogic S&P Case-Shiller Mid-Tier Home Price Index, 1988 – Present Real Estate Cycles, SF Bay Area
San Francisco 5-County Metro Area* – January Data Points
“Mid Tier” Price Houses, January Data Points

Price changes based on January 2000 value = 100. Data points above are for January of each year, except as noted. *The C-S Index 5-county San Francisco Metro Statistical Area includes San Francisco, Marin, San Mateo, Alameda and Contra Costa counties. The Index is published 2 months after the month specified. Graph not proportional from 1988-2000. All numbers approximate and subject to revision.
CoreLogic S&P Case-Shiller Low-Tier Home Price Index, 1988 – Present Real Estate Cycles, SF Bay Area
San Francisco 5-County Metro Area* – January Data Points
San Francisco 5-County Metro Area* – January Data Points
“Low Price Tier” Houses, January Data Points, except last reading

Price changes based on January 2000 value = 100. Data points above are for January of each year, except as noted. *The C-S Index 5-county San Francisco Metro Statistical Area includes
San Francisco, Marin, San Mateo, Alameda and Contra Costa counties. The Index is published 2 months after the month specified. Graph not proportional from 1988-2000.
San Francisco, Marin, San Mateo, Alameda and Contra Costa counties. The Index is published 2 months after the month specified. Graph not proportional from 1988-2000.
CoreLogic S&P Case-Shiller Home Price Index - Condos
1995 – Present, San Francisco 5-County Metro Area*
1995 – Present, San Francisco 5-County Metro Area*

Price changes based on January 2000 value = 100. Year markers are for January of the designated year. *The C-S Index 5-county San Francisco Metro Statistical Area includes San Francisco, Marin, San Mateo, Alameda and Contra Costa counties. Data from sources deemed reliable but may contain errors and subject to revision.
S&P Dow Jones Indices LLC, S&P/Case-Shiller U.S. National Home Price
Compass is a real estate broker licensed by the State of California, DRE 01527235. Equal Housing Opportunity. This report has been prepared solely for information purposes. The information herein is based on or derived from information generally available to the public and/or from sources believed to be reliable. No representation or warranty can be given with respect to the accuracy or completeness of the information. Compass disclaims any and all liability relating to this report, including without limitation any express or implied representations or warranties for statements contained in, and omissions from, the report. Nothing contained herein is intended to be or should be read as any regulatory, legal, tax, accounting or other advice and Compass does not provide such advice. All opinions are subject to change without notice. Compass makes no representation regarding the accuracy of any statements regarding any references to the laws, statutes or regulations of any state are those of the author(s). Past performance is no guarantee of future results.
Share: