
Marin County Real Estate
Home Prices by City; Short-Term & Long-Term Appreciation Trends; Migration In & Out of County; Price Reductions; Unsold Inventory
September 2019 Report
After the heat of the spring market, activity typically slows down markedly in July and August. In September, listings start coming on the market to fuel the relatively short autumn selling season. What occurs in the next 2+ months will be the next major indicator of market conditions and direction.
Home Prices by City
Some of the city markets delineated below have few sales, especially in a specific home size: A blank field indicates insufficient data. A house with more bedrooms is not necessarily larger than one with less, and the size and quality of homes of identical bedroom counts vary enormously. Many factors affect sales prices besides neighborhood/ bedroom count: quality of location within the neighborhood, condition, size, architecture, views, amenities, parking, outdoor space, etc. Median prices should always be considered generalities.


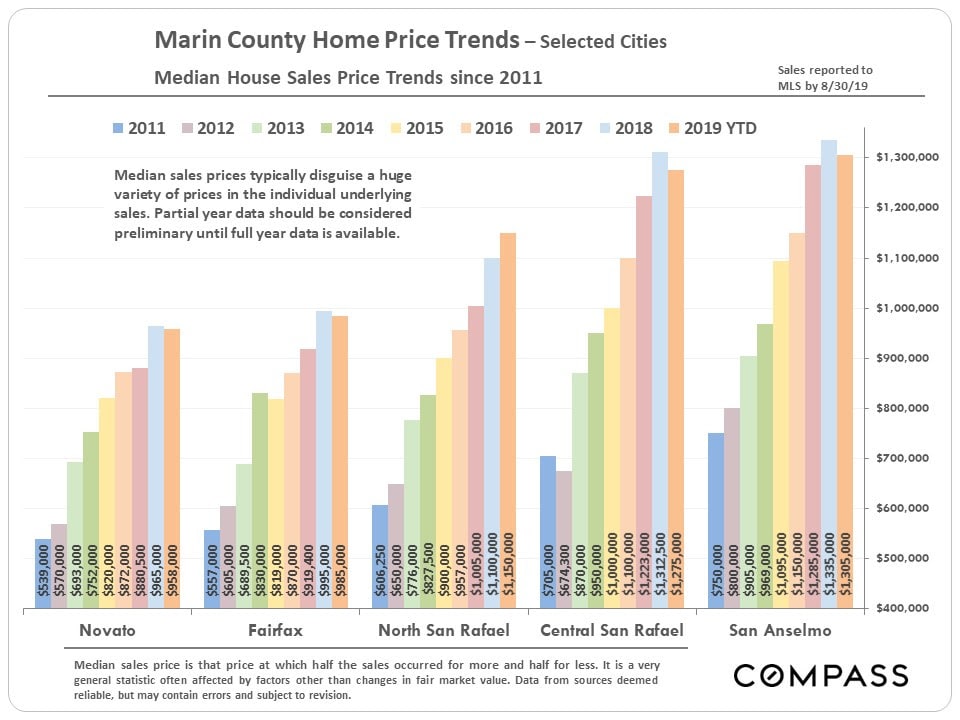
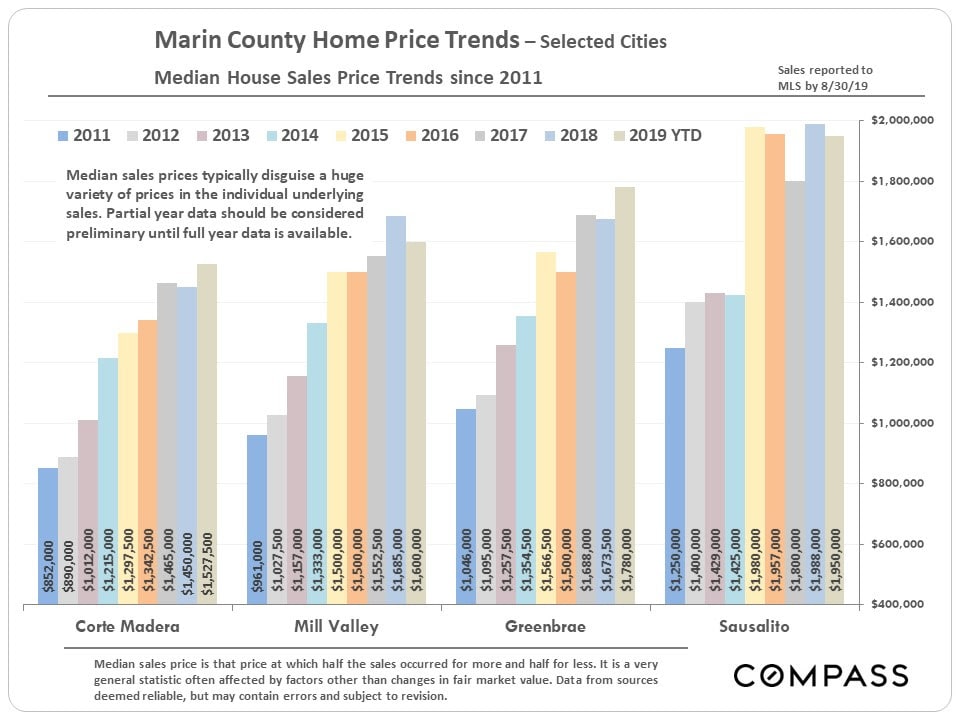
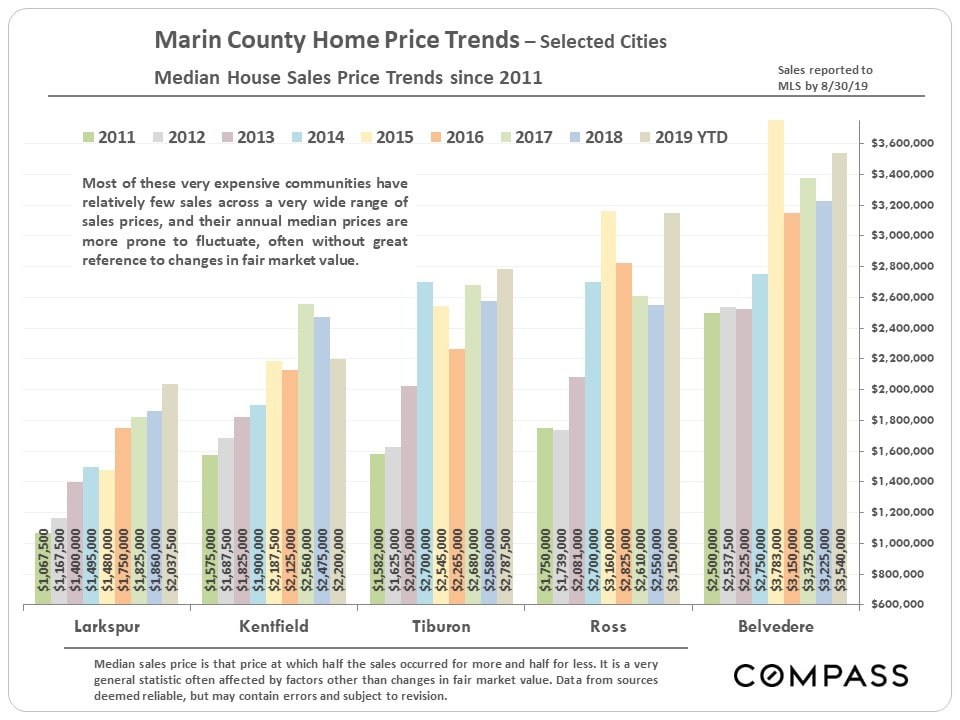
Home Price Appreciation since 2011 -
for Selected Marin Cities
As seen below, with 2019 YTD median house prices, some Marin cities are a bit up from 2018, some a bit down, and a couple basically flat. The problem with Marin is that many of its communities don't have that many sales - especially true of some of the county's most expensive markets - which can lead to anomalous fluctuations in median prices. Full-year 2019 median prices may well be different than those for the first 8 months.


Migration In & Out of County
Using new U.S. Census estimates released 8/29/19, this chart attempts to identify U.S. counties, states and international regions with the highest number of residents migrating to and from our county. In the Bay Area, there is a general trend outward from more expensive to more affordable places, while in-bound migration is deeply affected not only by exchanges between Bay Area counties, but people arriving from other parts of the state, country and world. Areas often have large two-way exchanges of residents, as between Marin and Sonoma, and Marin and San Francisco.
Foreign in-migration is a big issue in the Bay Area, but it will be another year before any impact of new U.S. immigration policy on foreign in-migration in 2018 shows up in census numbers. In the last census estimate, Europeans made up the largest share of foreign immigrants to Marin.


Short-Term & Long-Term Trends
in Median Home Values

For the county as a whole, year-to-date median home values have ticked down a little. Again, this should be considered preliminary until full-year data is available.


Selected Market Statistics
The chart below compares supply, the number of active listings on the market, with demand, as measured by the number of sales. This is a seasonally adjusted graph that smooths out normal monthly fluctuations to provide clearer historical trend lines. As context, the data below begins in 2013, after the market recovery was already well underway. If the data went back to the 2009 – 2011 period, during the post-crash market recession, the divergence between the two lines would be much, much greater than at any time illustrated here. (Note that the seasonally adjusted data on Marin monthly sales volume is still a few months behind.)


Generally speaking, the percentage of active listings undergoing price reductions spiked in mid-2018 and has remained somewhat elevated since then. The big factor behind the spike was that the late 2017/ early 2018 market was very hot. When the market began to cool off, sellers and listing agents – relying upon recent sales data to set new listing prices – were wrong-footed by the softening in supply and demand dynamics. Sometimes, it takes a while to adjust pricing to changing market realities.

The next chart measuring unsold inventory helps give greater context to market conditions and changes. The ups and downs since 2012 are relatively minor compared to the situation that prevailed during the 2008-2011 market recession, when monthly unsold inventory figures were highly elevated.