

Executive Summary:
- While April’s momentum is slightly slower in May, May sales are still only 2 percent below last year’s highs after double-digit declines earlier in the year.
- Home sales momentum remains solid in East Bay. Napa sales finally jumped 6 percent after a 6-month losing streak, averaging 20 percent annual declines.
- Affordable sales picked up again with sales of homes priced below $1 million up 3 percent year-over-year, the first two-month consecutive annual increase in the last four years.
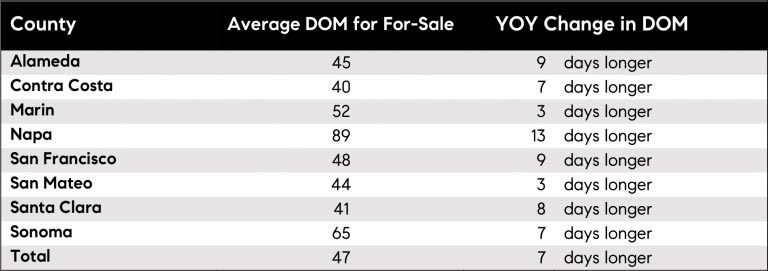
- For-sale inventory growth is slowing after the winter jump with homes averaging seven days longer on the market.
- San-Francisco continues to see significant inventory declines with May down 19 percent YOY (four months of declines averaging 20 percent).
- Buyer competition picks up again with 58 percent of homes selling over the asking price.
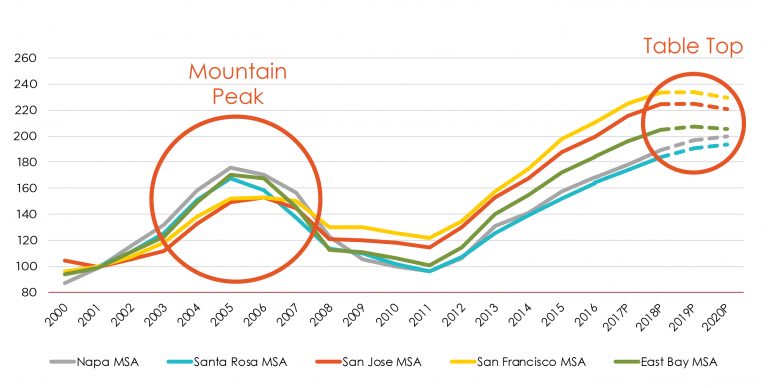
- Bay Area housing market correction resembles “Table Top” with prices remaining flat, compared to “Mountain Top” seen in the last cycle when prices fell significantly following the peak.
Following a solid improvement in the Bay Area housing markets in April, May homes sales activity continued with the momentum, albeit slower. Total home sales were 2 percent below last May, following April’s upwardly revised 1 percent year-over-year decline. The rate of declines has slowed considerably after double-digit declines seen in the first few months of 2019. Taking the first five months of the year together, sales are 5 percent below last year.
However, while declines continue to be driven by slower sales in Santa Clara and San Mateo, East Bay home sales are keeping the momentum. Napa sales jumped 6 percent after a 6-month losing streak, averaging 20 percent annual declines. San Francisco, the spotlight of expectations around IPO impacts, remained relatively flat with last year, down 1 percent, though San Francisco sales peaked last May at the highest numbers of May sales in at least the last four years. Overall, most all markets except Sonoma saw improvement in sales in at least one price range. Table 1 summarizes year-over-year changes in the number of homes sold by price range.
Table 1

Source: Terradatum, Inc. from data provided by local MLSes, June 7, 2019
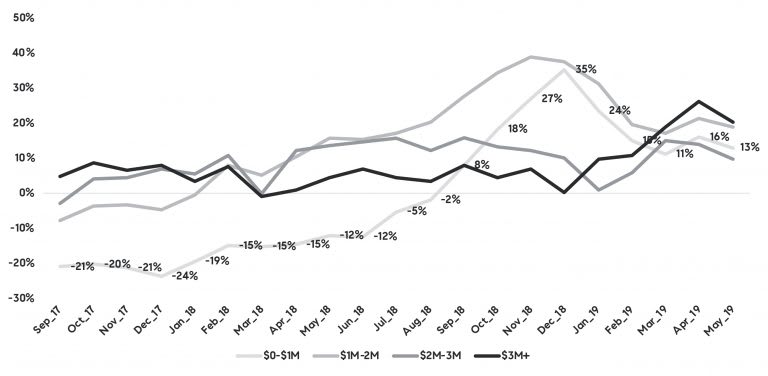
As noted in last month’s analysis, the most encouraging improvement considering Bay Area’s affordability concerns is the increase in sales of homes priced below $1 million, which showed its first two-month consecutive annual increase in the last four years. Figure 1 illustrates the trend of year-over-year changes in home sales by price range. As Table 1 suggests, the increase in lower priced sales is mostly driven by East Bay, but also Santa Clara where lower priced sales have been increasing since the beginning of the year after drops averaging 40+ percent in 2018. In contrast, San Mateo, San Francisco and Marin continued to see declines in lower priced sales as that inventory has largely disappeared – for example, in the three regions, less than a third of homes available for sale are priced below $1 million.
Figure 1 Year-over-year change in the number of homes sold

Source: erradatum, Inc. from data provided by local MLSes, June 7, 2019
Figure 2 Year-over-year change in number of homes for sale by price range
Source: Terradatum, Inc. from data provided by local MLSes, June 7, 2019

Source: Terradatum, Inc. from data provided by local MLSes, June 7, 2019
Table 2
Source: Terradatum, Inc. from data provided by local MLSes, June 7, 2019

Source: Terradatum, Inc. from data provided by local MLSes, June 7, 2019
Furthermore, while buyer competition is not at the same level as last summer, when housing market activity peaked, it continues to ramp up from slower start to 2019. Seasonally, buyer competition peaks in May with the highest rate of homes selling over the asking price in a given year. This May, almost 6 in 10 homes sold over the asking price, which is below the last three years when about 7 to 8 in 10 homes sold over the asking price, but still suggest solid buyer demand. Figure 3 illustrates the trend in the share of homes selling over the asking price. Regionally, the difference from last May has been smallest in San Francisco, where 72 percent of homes are still selling over the asking price, down from 75 percent last May. The most notable decline in buyer competition remains in Santa Clara where 56 percent of homes are selling over the asking price, down from 89 percent.
Figure 3 Share of homes selling over the asking price

Source: Terradatum, Inc. from data provided by local MLSes, June 7, 2019
As noted in the last month’s analysis, San Francisco’s housing market resilience remains further evident in absorption rates of available inventory, which is up 8 percent points compared to last May and is the only area where absorption rate has increased on an annual basis. Granted, San Francisco is also the only region where inventory continues to decline, down 19 percent in May. This brings us to the question around the impact of recent and anticipated IPOs. While it doesn’t appear that San Francisco housing is bubbling out of control, it is difficult to say where it would be in the counterfactual. In other words, would the market currently be worse off or similar to where it is if it wasn’t for the IPO expectations?
In the least, it is clear that the strength of the Bay Area economy and continued job growth is driving solid demand from buyers across the region, both for affordably priced homes as well as higher-priced homes. And while the number of sales is lower than last year, it is important to keep in mind that last summer housing market activity peaked, and current conditions are suggesting leveling off or normalization of those unsustainable trends, particularly in areas in Silicon Valley or post-fire Sonoma. Further, buyers, may are holding off fearing that housing market correction is inevitable and are waiting for sellers to yield further and lower their expectations. And while recent softening of price growth suggest correction is under way, it is unlikely that it will be the correction that we saw in the last housing cycle. Credit conditions are significantly different than in the last cycle. The current housing boom was driven by exceptionally solid underwriting and significant share of all-cash purchases, coupled with almost negligible new construction growth, both of which suggest that the correction path is looking notably different. In the Pacific Union Real Estate Economic Forecast 2020. “Table Top” is unlike the “Mountain Peak” seen during the last housing cycle in 2004 to 2017 when home prices rapidly declined as much as 60 percent following the peak.
Figure 4 John Burns Home Value Index
Source: Pacific Union International Real Estate Economic Forecast, San Francisco Bay Area to 2020

Source: Pacific Union International Real Estate Economic Forecast, San Francisco Bay Area to 2020