Bay Area Demographic and Economic Angles

Bay Area Demographic and Economic Angles

 
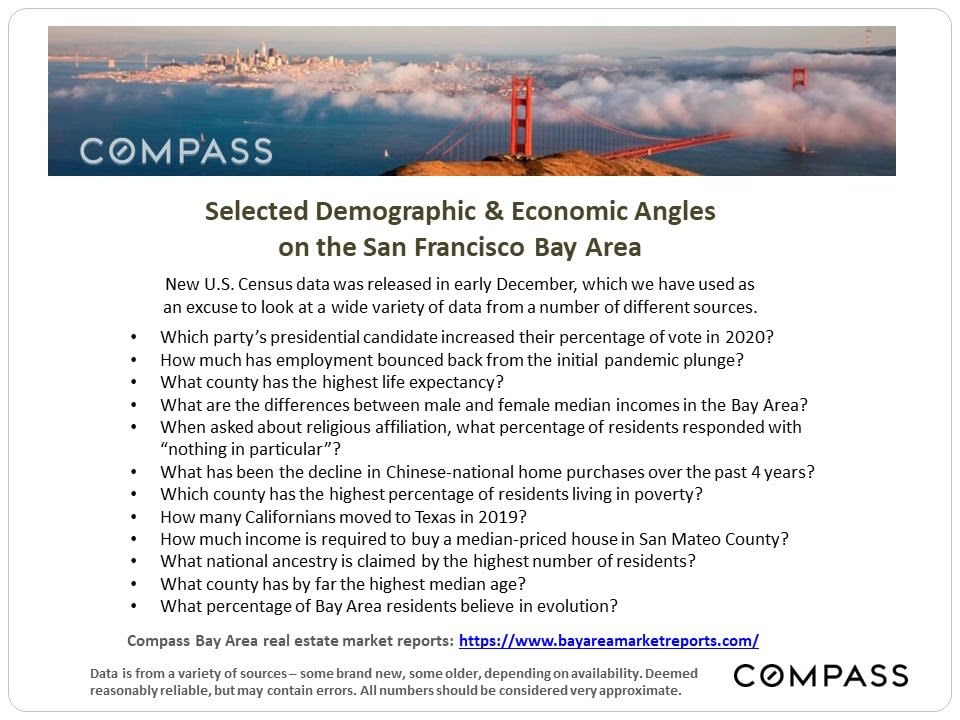
San Francisco Bay Area demographic and economic infographic with census questions and a cloudy Golden Gate Bridge panorama.
 
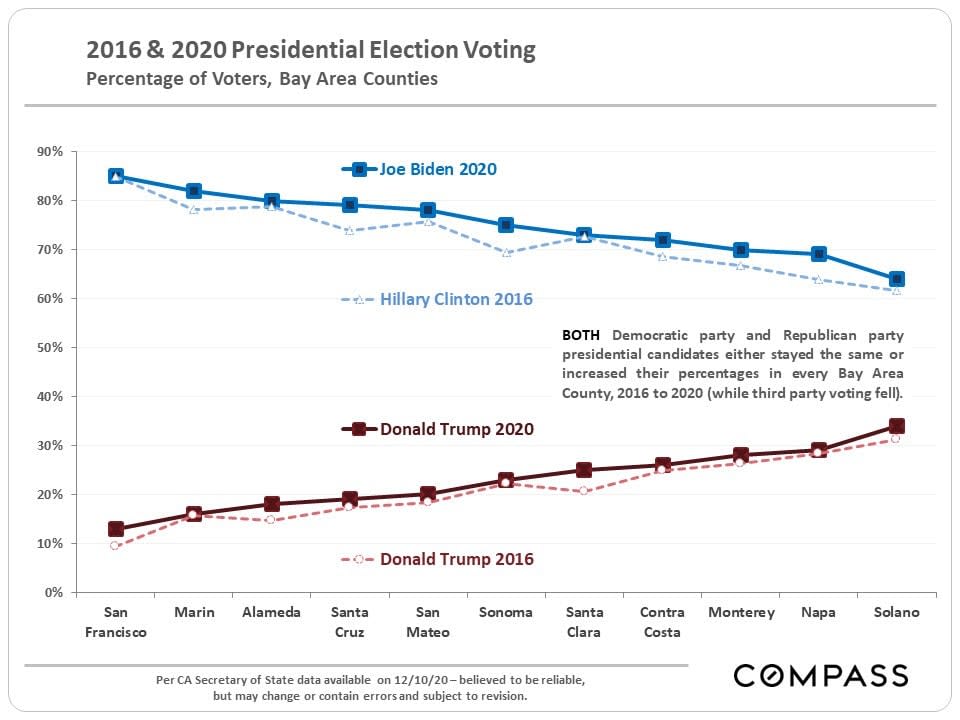
Chart comparing 2016 and 2020 presidential vote percentages across eleven Bay Area counties.
 
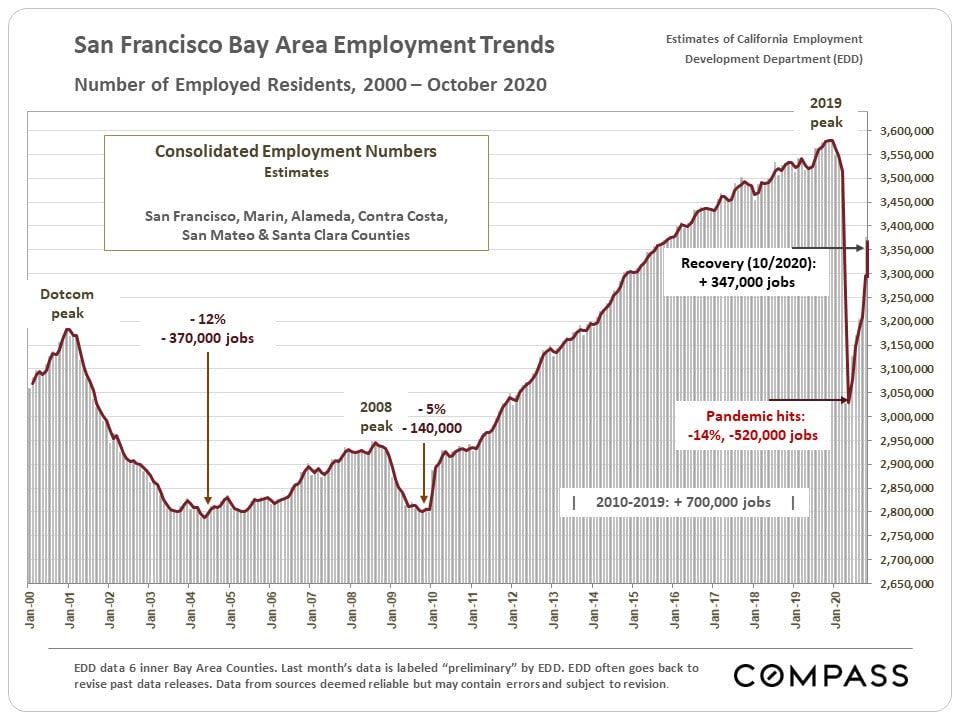
San Francisco Bay Area employment trend chart, 2000–2020, showing the pandemic decline and recovery.
 
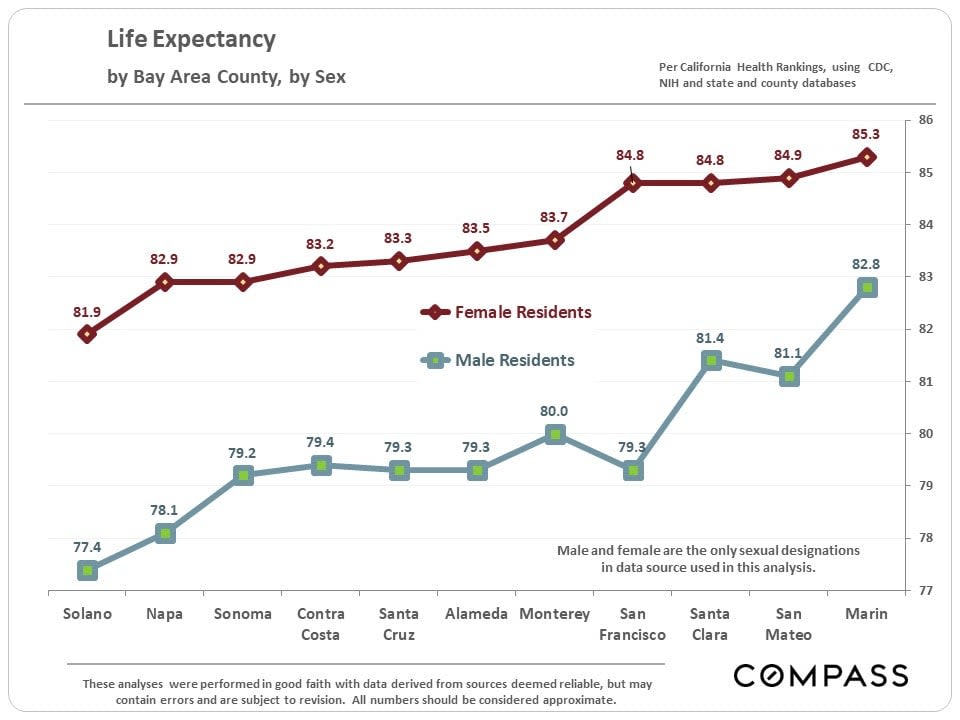
Line chart of life expectancy by Bay Area county: female values exceed male values in all 11 counties.
 
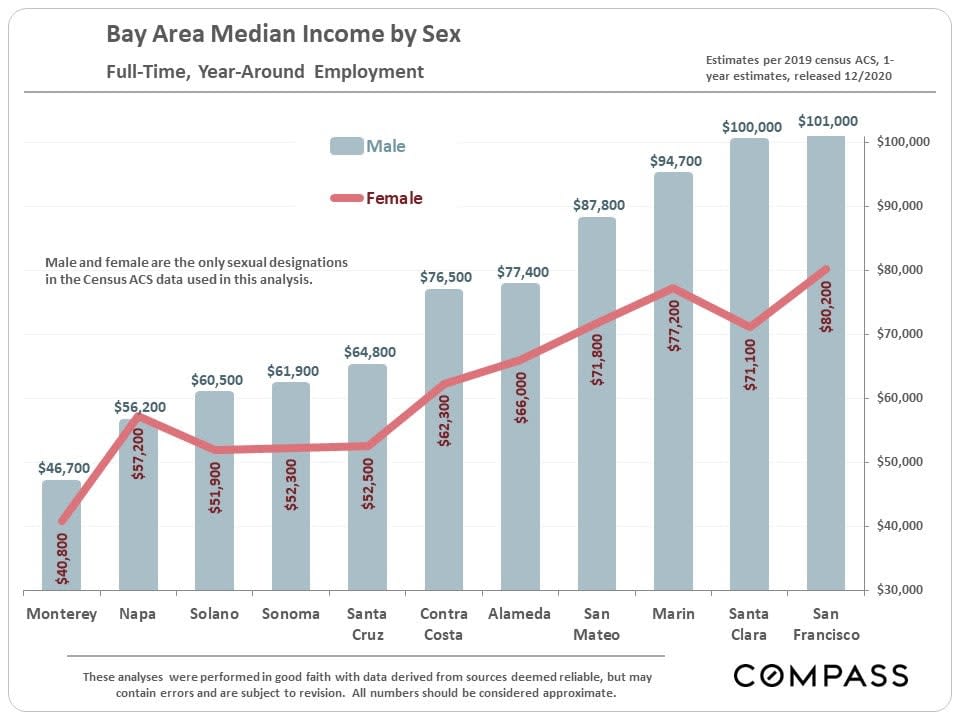
Bar chart comparing median full-time, year-round income by sex across Bay Area counties.
 
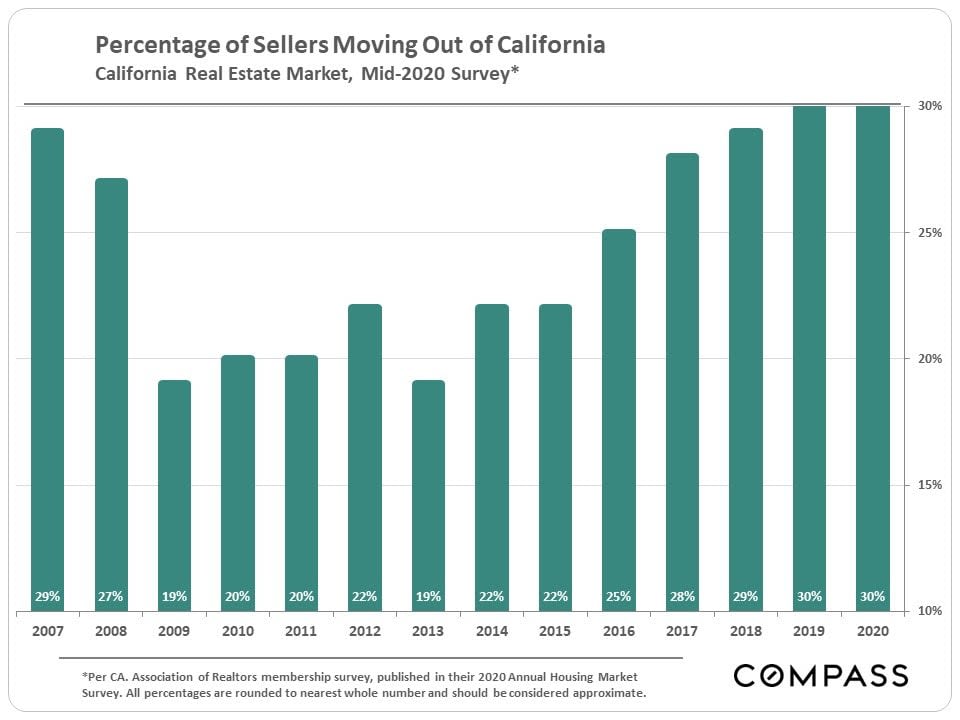
Bar chart of California sellers moving out of state, rising to 30% in 2019 and 2020.
 
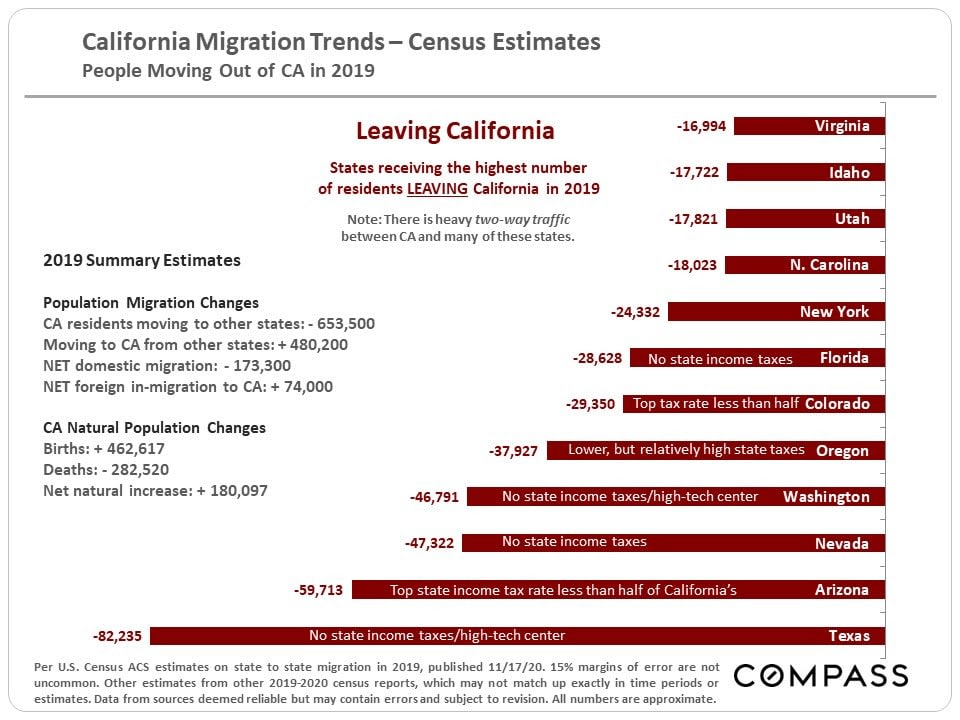
Infographic summarizes California’s 2019 migration estimates, with a bar chart showing Texas as the leading destination state.
 
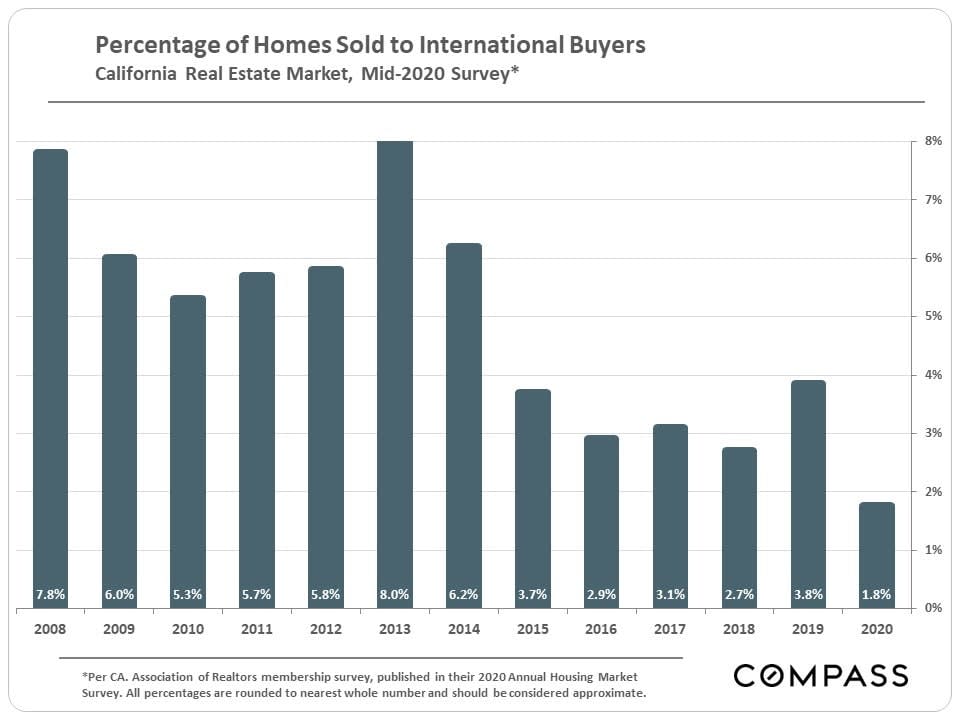
Bar chart of international buyers’ share of California home sales, peaking at 8.0% in 2013 and falling to 1.8% in 2020.
 
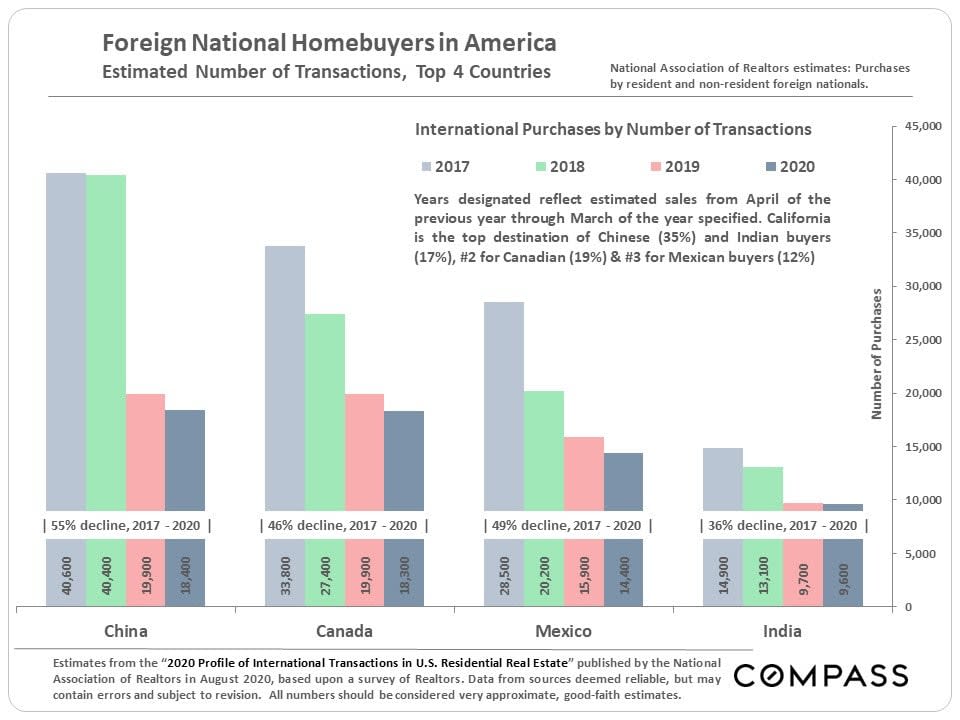
Bar chart comparing foreign homebuyer transactions from China, Canada, Mexico, and India, 2017–2020.
 
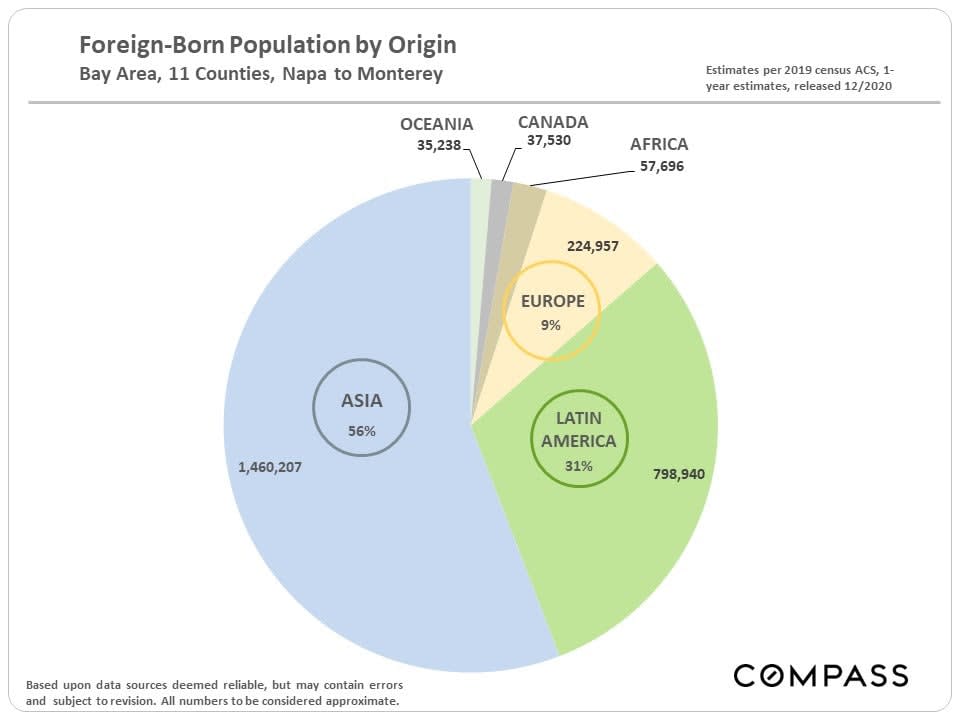
Pie chart of Bay Area foreign-born population by origin, led by Asia at 56% and Latin America at 31%.
 
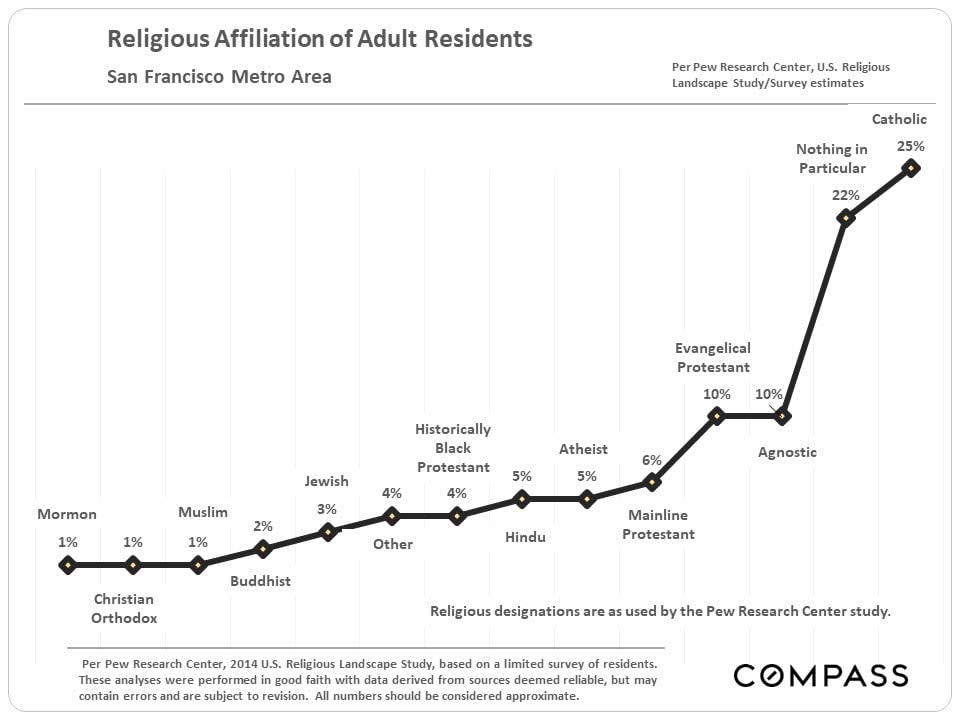
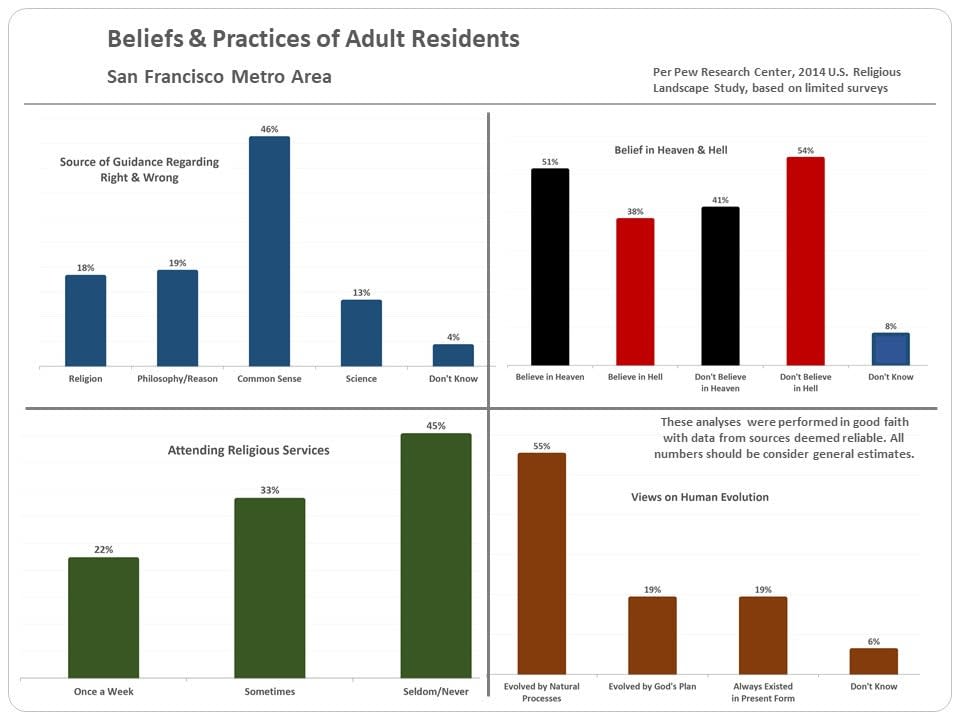
Chart of religious affiliation estimates for adult residents in the San Francisco metro area.
 
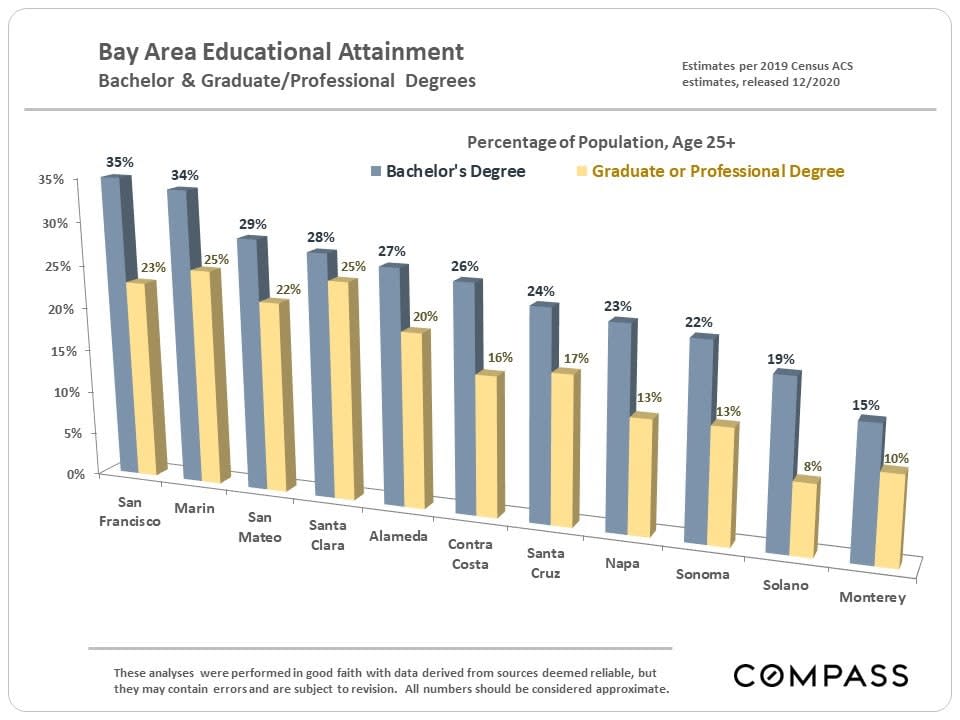
Chart compares bachelor’s and graduate degree attainment across 11 Bay Area counties; San Francisco leads in bachelor’s degrees.
 
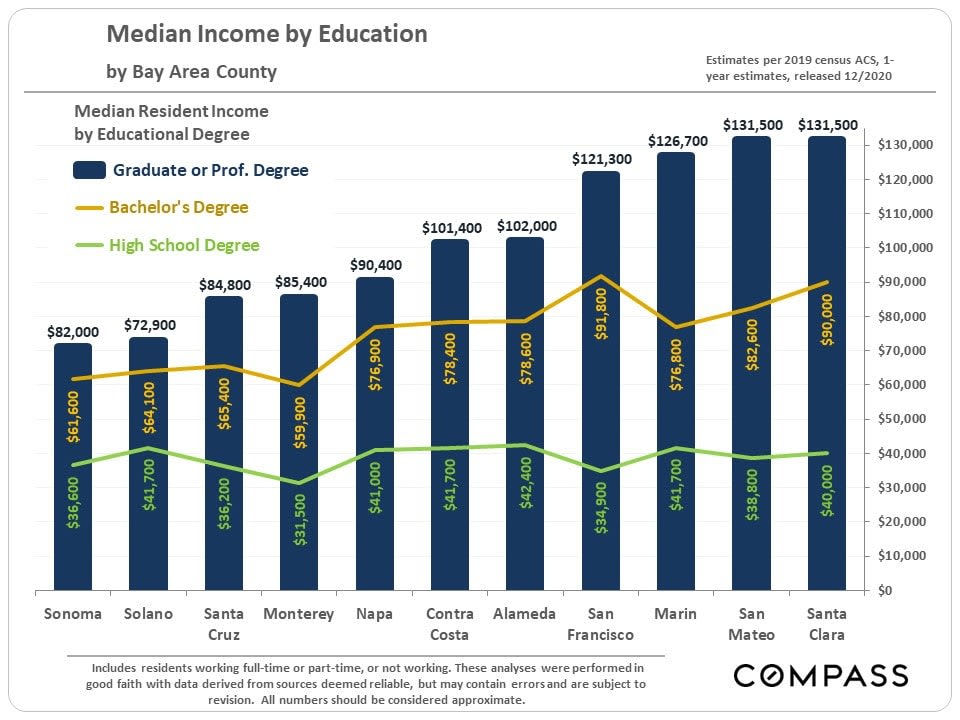
Bay Area county income chart comparing graduate, bachelor's, and high school education levels.
 
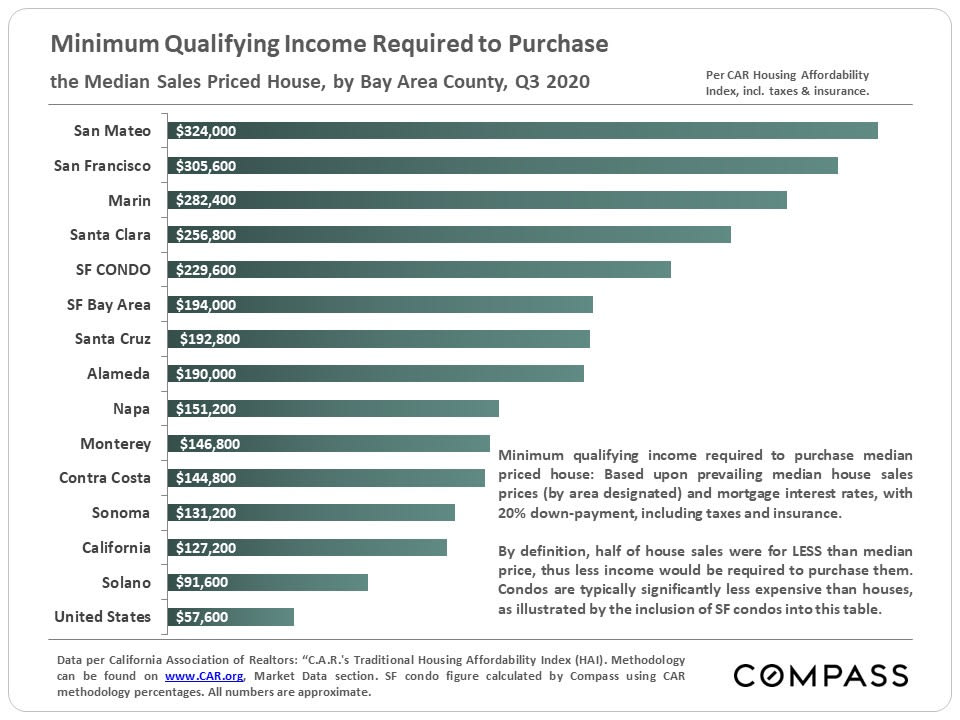
Bar chart comparing minimum income needed to buy a median-priced home across Bay Area counties in Q3 2020.
 
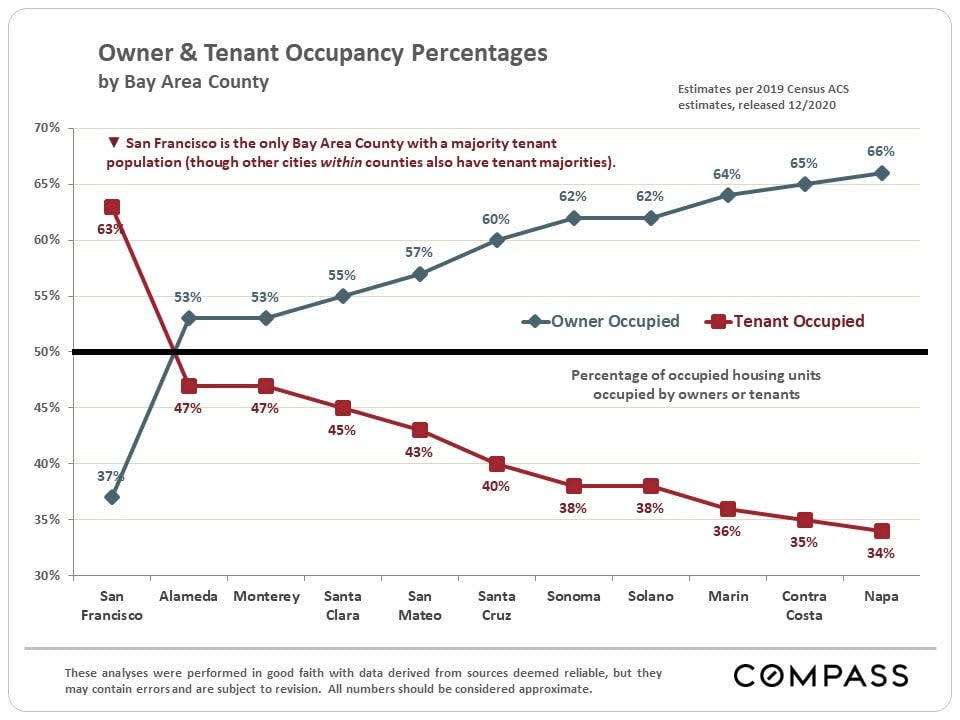
Chart compares owner and tenant occupancy percentages across 11 Bay Area counties; San Francisco has the highest tenant share at 63%.
 
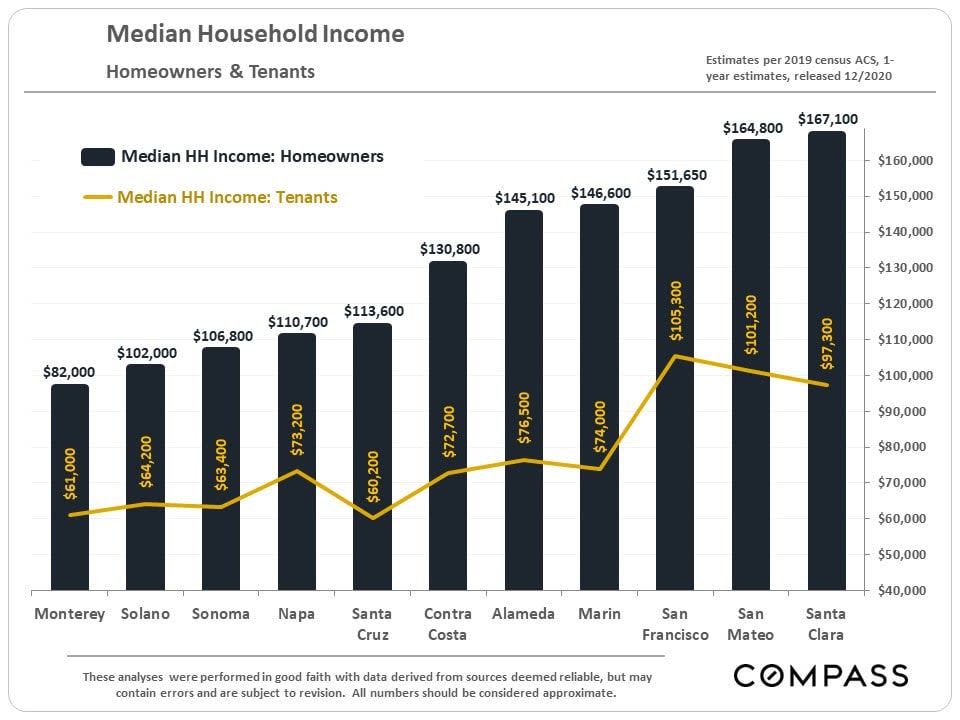
Chart comparing median household incomes for homeowners and tenants across eleven Bay Area counties.
 
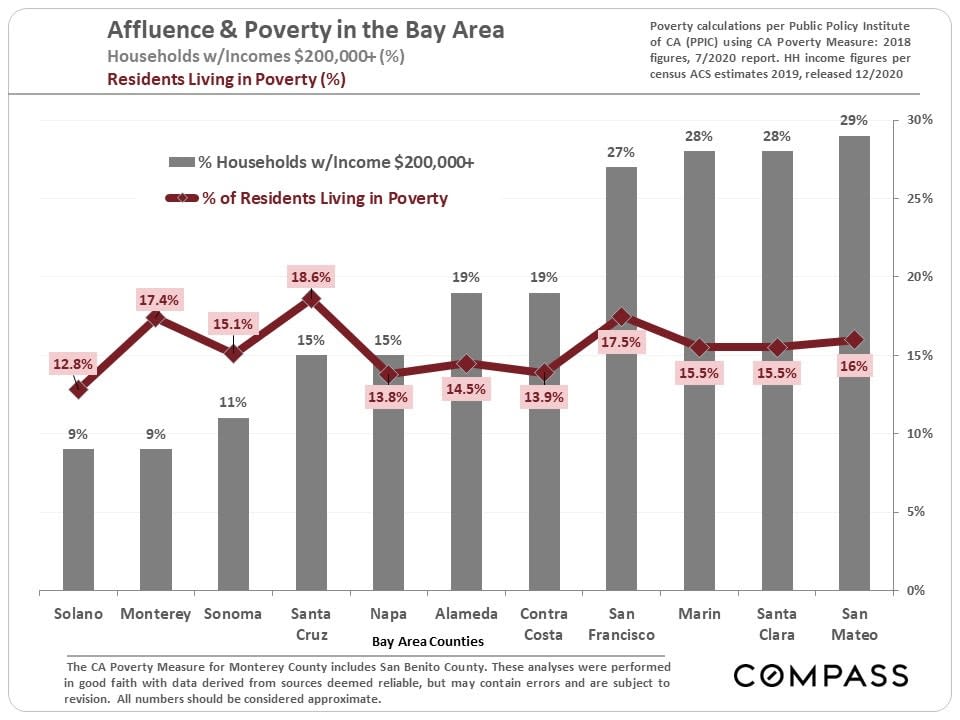
Chart compares high-income households and residents living in poverty across 11 Bay Area counties.
 
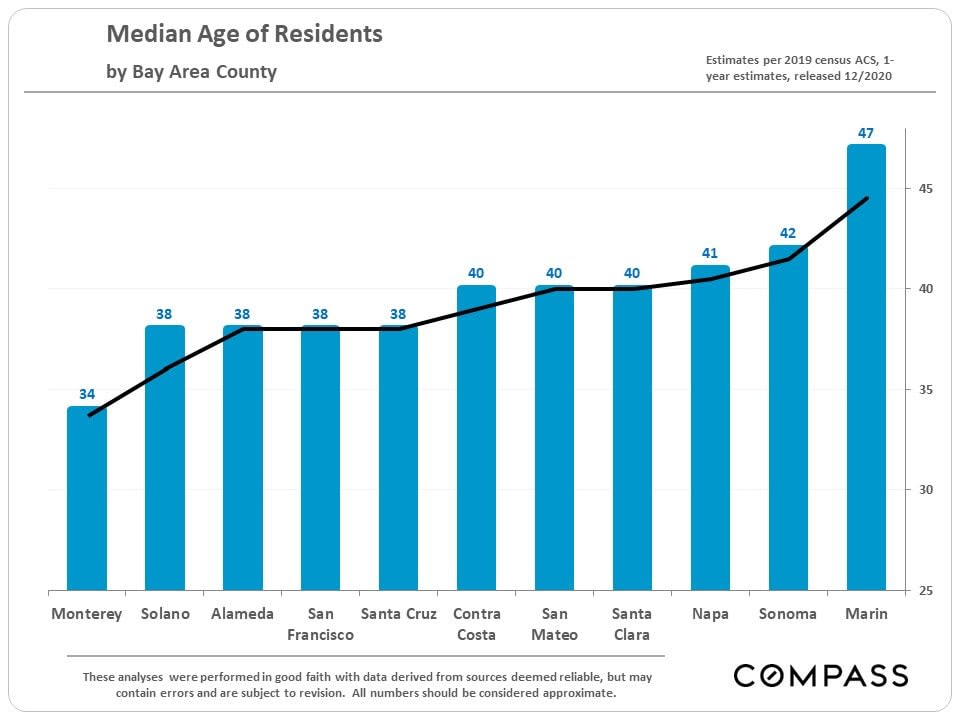
Bar chart of median ages by Bay Area county, ranging from 34 in Monterey to 47 in Marin.
 
Chart comparing San Francisco adults’ religious guidance, beliefs, service attendance, and views on evolution.
 
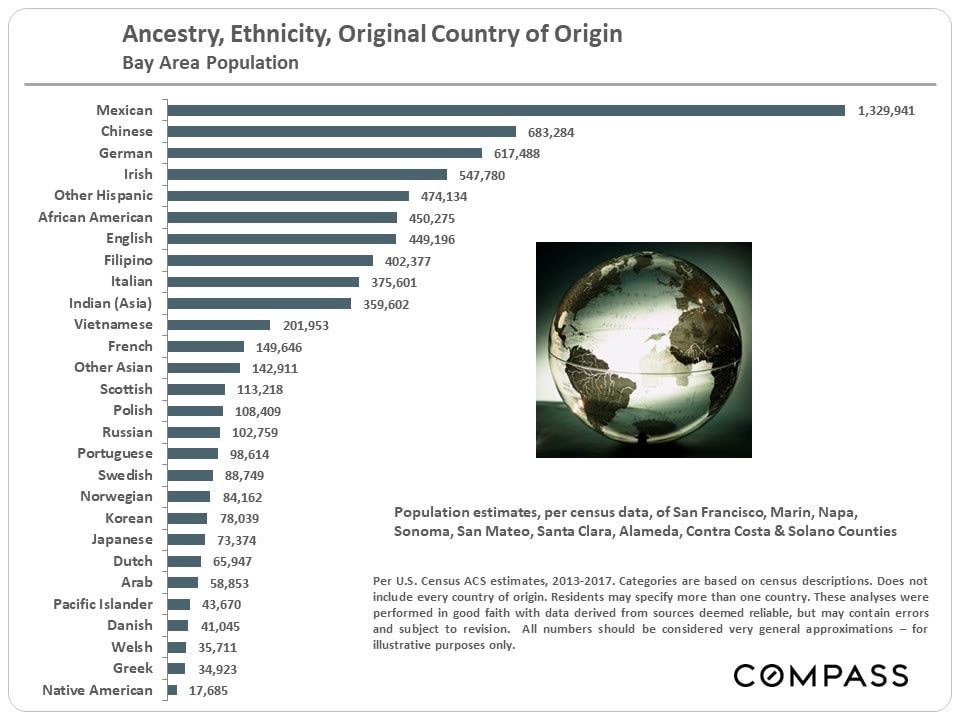
Bay Area population ancestry and ethnicity chart with a globe illustration and Compass branding.
 
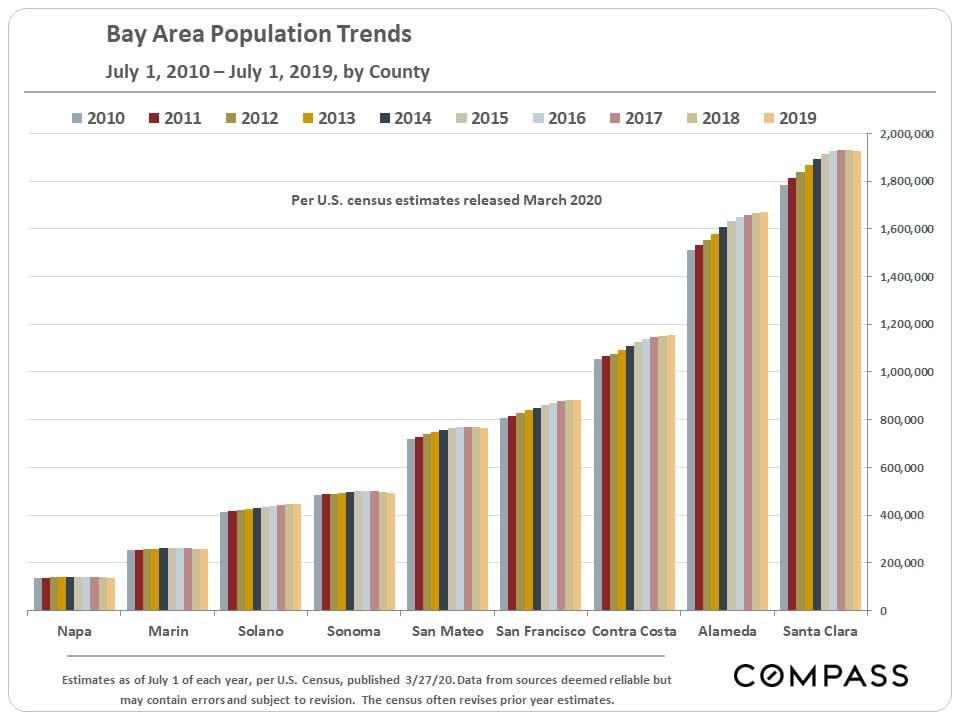
Bar chart of Bay Area county population estimates from 2010 to 2019, with Santa Clara highest.
 
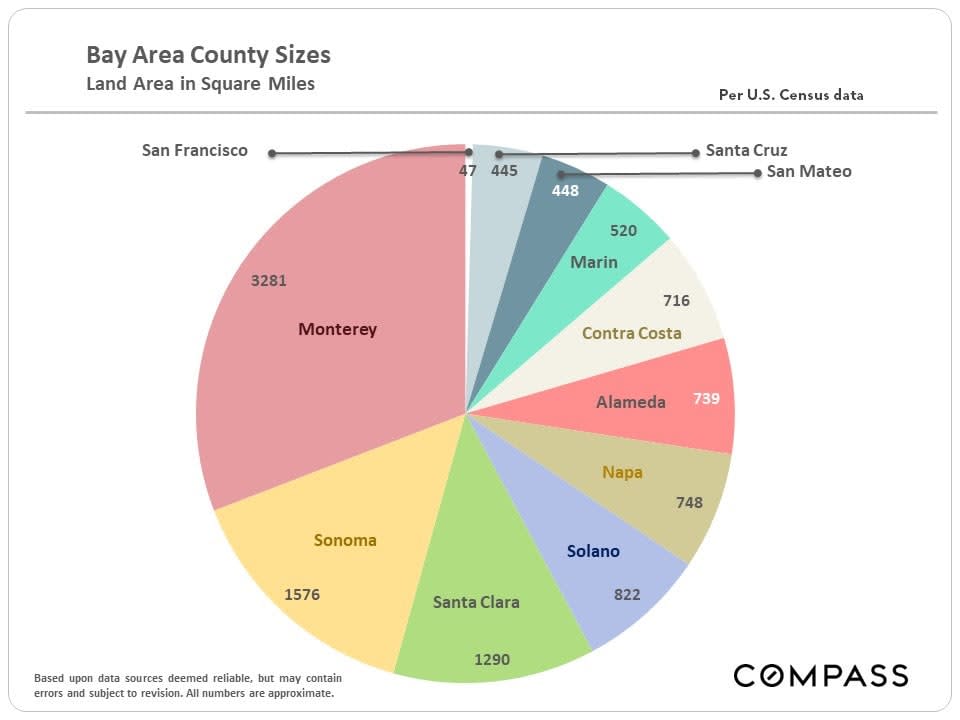
Pie chart comparing Bay Area county land areas in square miles; Monterey is largest.
 
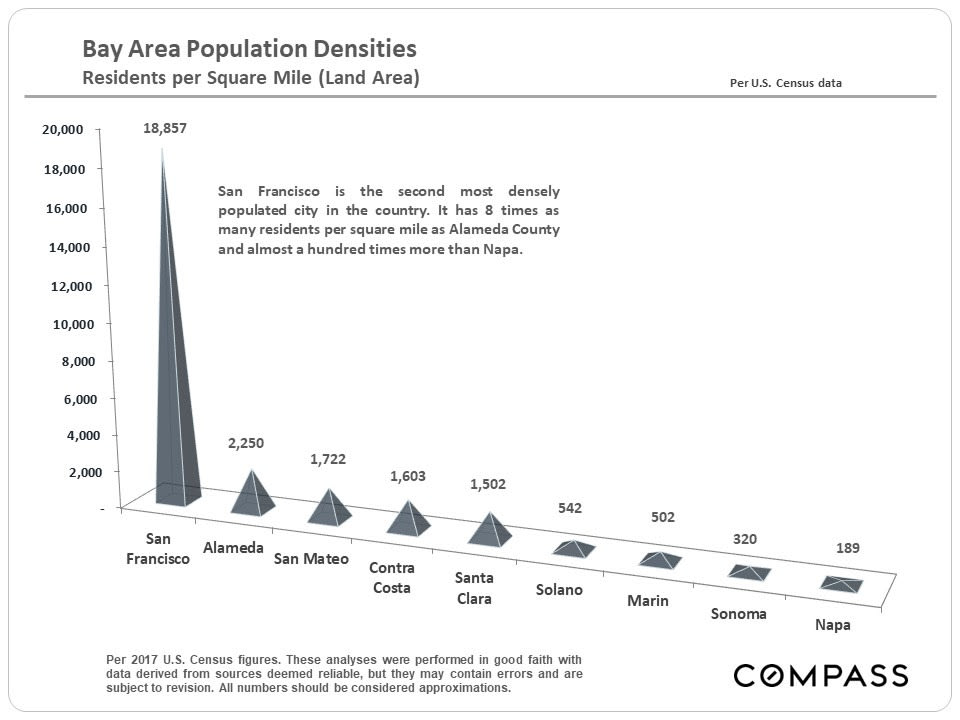
Chart comparing population density across nine Bay Area counties, with San Francisco highest and Napa lowest.


Work With Me

Every client is different, and I strongly believe in understanding your unique needs, and helping you achieve your goals. Because of this commitment, I have distinguished myself by generating 80% of my business from client referrals.

Follow Me on Instagram